Test a Liquidation Model with Inputs That Should Not Change the Answer
A backtest can process millions of prices while carrying the same small accounting mistake through every calculation. Before adding more historical data, it is worth asking a simpler question: does the model behave consistently when the scale of an example changes? A plausible-looking price is weak evidence if nobody has checked what should remain constant.
The worked tests here use the fixed-maintenance model described by BitcoinMargin’s [liquidation price calculator](https://bitcoinmar
Establish a small case that can be checked by hand
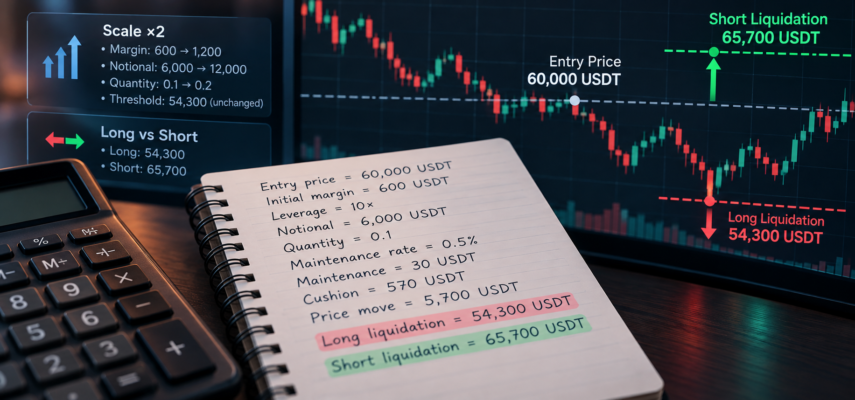
Consider an invented linear long position entered at 60,000 USDT, supported by 600 USDT of initial margin at ten-times leverage. Its entry notional is 6,000 USDT, and its quantity is 0.1 units of the underlying asset. With an illustrative maintenance rate of 0.5 per cent applied to entry notional, the fixed maintenance amount is 30 USDT.
That leaves 570 USDT above maintenance. Dividing by the quantity of 0.1 converts this cushion into a 5,700-USDT adverse price move. The model’s long threshold is therefore 54,300 USDT. Each number has a unit and a role. Notional, collateral, quantity and a price difference cannot be substituted for one another simply because a spreadsheet accepts them.
## Double the scale without changing the percentage assumptions
Now double initial margin to 1,200 USDT while retaining the same entry price, leverage and maintenance rate. Under these assumptions, notional also doubles to 12,000 USDT. Quantity becomes 0.2, fixed maintenance becomes 60 USDT, and the cushion becomes 1,140 USDT.
Dividing 1,140 by 0.2 again gives a 5,700-USDT price move. The threshold remains 54,300 USDT. This invariance is a useful arithmetic check: every monetary amount scaled together, leaving the same proportional cushion per unit.
It does not mean that the larger position has the same financial consequences. Exposure and the loss measured in USDT from a given price move have doubled. It is also different from adding collateral while holding quantity fixed. A test record must say which experiment was performed. In a real venue, increasing position size might cross a maintenance tier, invalidating this deliberately constant-rate comparison.
## Reverse direction, but only inside the stated model
Return to the original scale and change the hypothetical long into a short. In this fixed-maintenance illustration, the same 5,700-USDT cushion lies above entry, producing a short threshold of 65,700 USDT. Both directions are 9.5 per cent from the entry price.
That symmetry belongs to this simplified model, not to all liquidation systems. [Bybit’s current isolated-margin formulas](https://www.bybit.co
The right response to that difference is to identify the intended calculation. Do not alter an independent model until it matches an exchange screenshot while leaving its assumptions undocumented.
## Treat an extreme input as a question, not a trading opportunity
A boundary case can reveal another category of error. At ten-times leverage, initial margin equals ten per cent of entry notional. If the invented fixed maintenance requirement is also ten per cent, the model has no cushion above maintenance at entry. Its calculated threshold meets the entry price.
This is a deliberately stressed mathematical example, not an available contract quotation or a viable position. A real interface may reject the combination, restrict leverage or apply different requirements. Record that response separately from the arithmetic. Input validation and the calculation itself are different things to test.
Likewise, an unavailable output must not be converted to zero or read as freedom from liquidation. [Kraken’s liquidation FAQ](https://support.kraken.co
## Preserve the tests when moving to a backtest
Keep the baseline inputs, expected arithmetic, contract definition and exclusions beside the research code. Repeat the small cases after changing units or calculation logic. Then assess what historical data can actually support: a model requiring mark prices cannot be validated solely by a series of last-traded prices.
Passing these checks establishes consistency only within the stated assumptions. It does not prove that historical fills were possible, that an exchange will use the same threshold, or that a strategy will be profitable. Fees, changing maintenance requirements and account-level collateral still need their own treatment.
The practical gain is modest but useful. Before a larger simulation produces an impressive chart, a few transparent examples can expose inconsistent scaling, mixed units or an undocumented model change. Crypto derivatives remain high-risk instruments; a checked calculation is not a recommendation to trade them.